linux工匠之heapster监控kubernetes
接着kubeadm部署kubernetes 1.8离线安装绝对成功版,需要对kubernetes做监控。 docker的监控(cadvisor+prometheus) 有写用cadvisor和prometheus监控kubernetes的docker服务,在kubernetes中更常用的是heapster,已经和kubernetes结合为一块了
首先下载heapster的yaml配置,依赖influxdb数据库和grafana图形展示
wget https://raw.githubusercontent.com/kubernetes/heapster/master/deploy/kube-config/influxdb/heapster.yaml
wget https://raw.githubusercontent.com/kubernetes/heapster/master/deploy/kube-config/rbac/heapster-rbac.yaml
wget https://raw.githubusercontent.com/kubernetes/heapster/master/deploy/kube-config/influxdb/grafana.yaml
wget https://raw.githubusercontent.com/kubernetes/heapster/master/deploy/kube-config/influxdb/influxdb.yaml
kubectl apply -f grafana.yaml
kubectl apply -f heapster-rbac.yaml
kubectl apply -f heapster.yaml
kubectl apply -f influxdb.yaml
# kubectl get po -n kube-system
NAME                                       READY     STATUS    RESTARTS   AGE
calico-etcd-l7m4p                          1/1       Running   2          3d
calico-kube-controllers-685f8bc7fb-l89qq   1/1       Running   2          3d
calico-node-vcfd6                          2/2       Running   5          3d
calico-node-wrj2q                          2/2       Running   3          2d
etcd-master                                1/1       Running   3          3d
heapster-844cd8b5c7-g97rh                  1/1       Running   1          1d
kube-apiserver-master                      1/1       Running   3          3d
kube-controller-manager-master             1/1       Running   3          3d
kube-dns-545bc4bfd4-s9btp                  3/3       Running   6          3d
kube-proxy-7wcjs                           1/1       Running   3          3d
kube-proxy-dbnz5                           1/1       Running   1          2d
kube-scheduler-master                      1/1       Running   2          3d
kubernetes-dashboard-7556d8744-g6cq7       1/1       Running   1          1d
monitoring-grafana-5f5d5cd4fc-7rwvn        1/1       Running   1          1d
monitoring-influxdb-785c4f4847-lb2vz       1/1       Running   1          1d
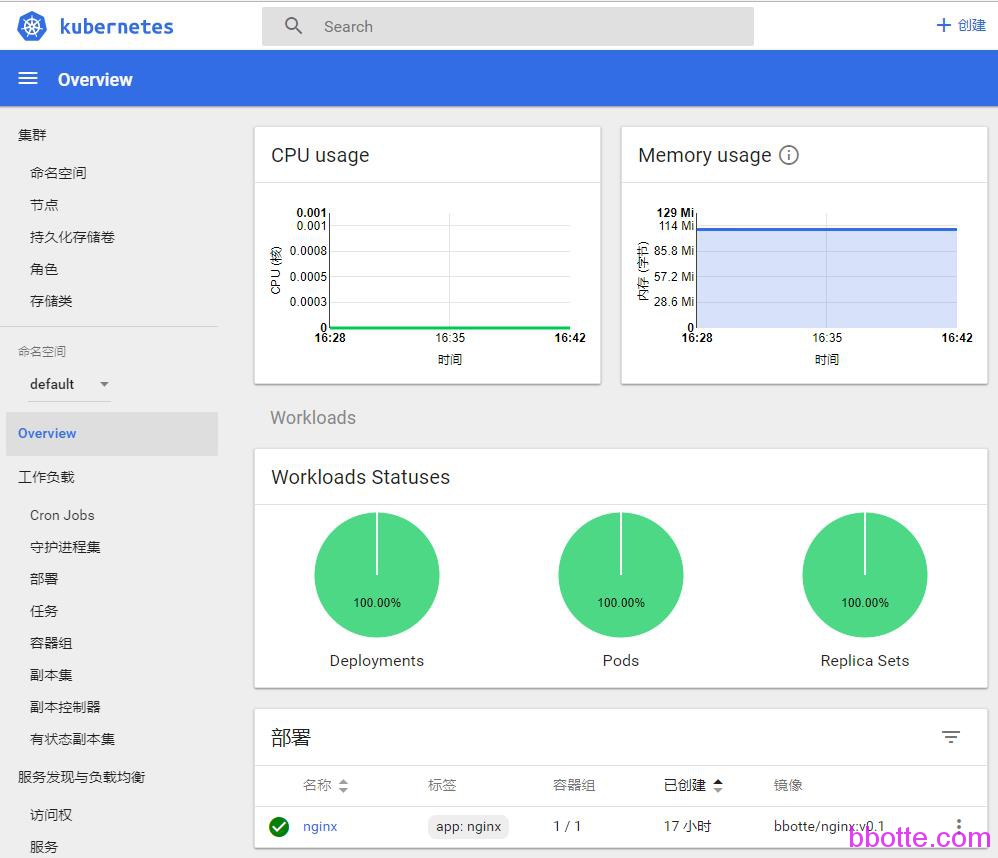
新建一个nginx服务,就可以在dashboard界面查看,相当方便,grafana界面这里查看
http://Master_IP/api/v1/proxy/namespaces/kube-system/services/monitoring-grafana/?orgId=1
如果打不开grafana的dashboard,那么就是proxy的问题了,
# kubectl get svc -n kube-system|grep grafana
monitoring-grafana        ClusterIP   10.99.206.53     <none>        80/TCP                        2d

# kubectl cluster-info
Kubernetes master is running at https://192.168.0.200:6443
Heapster is running at https://192.168.0.200:6443/api/v1/namespaces/kube-system/services/heapster/proxy
KubeDNS is running at https://192.168.0.200:6443/api/v1/namespaces/kube-system/services/kube-dns:dns/proxy
monitoring-grafana is running at https://192.168.0.200:6443/api/v1/namespaces/kube-system/services/monitoring-grafana/proxy
monitoring-influxdb is running at https://192.168.0.200:6443/api/v1/namespaces/kube-system/services/monitoring-influxdb/proxy

To further debug and diagnose cluster problems, use 'kubectl cluster-info dump'.

# kubectl proxy --address='192.168.0.200' --port=20080 --accept-hosts='^*$'
Starting to serve on 192.168.0.238:20080

端口随便写
浏览器访问:http://192.168.0.200:20080/api/v1/proxy/namespaces/kube-system/services/monitoring-grafana/?orgId=1
其实我在想heapster能和prometheus一样能报警就完美了,毕竟这个工具主要是做监控展示
所用到的yaml和docker images附度娘网盘,链接:https://pan.baidu.com/s/1jHSHsCe 密码:uu06
2017年12月14日 于 linux工匠 发表